Designing an Optimized Forced Draft Insert
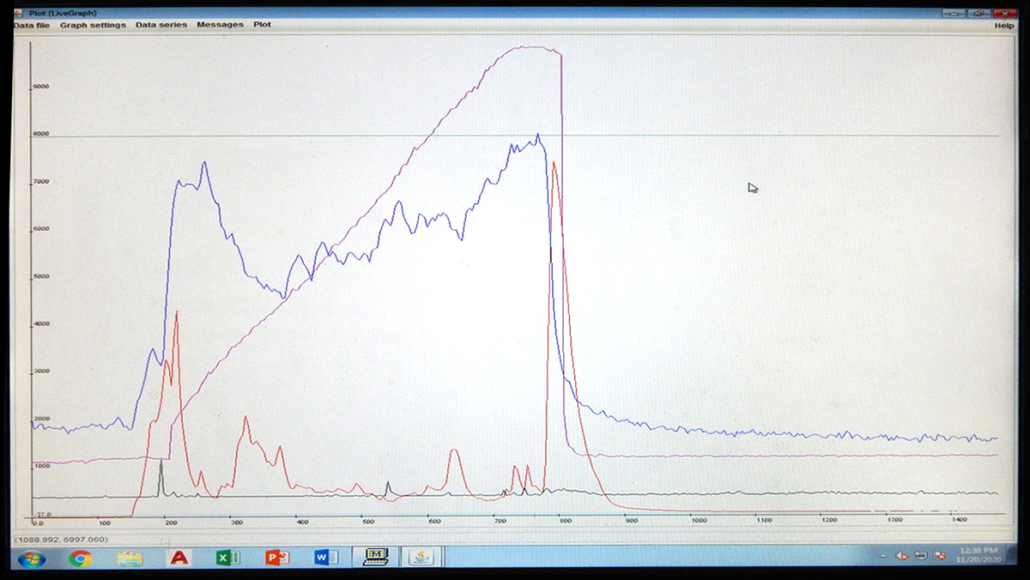
David Evitt, ASAT COO, and Sam Bentson, ARC GM, have been adding capacity to the Laboratory Emissions Monitoring System (LEMS). So far, four oxygen sensors, temperature probes in the fire and under the pot, and a velocity sensor give us a clearer picture of what’s going on in a stove. Knowing PM2.5, CO, CO2, and firepower at the same time, combined with the improved testing protocols in ISO 19867, is making us more confident that iterative improvement can be accomplished relatively quickly.
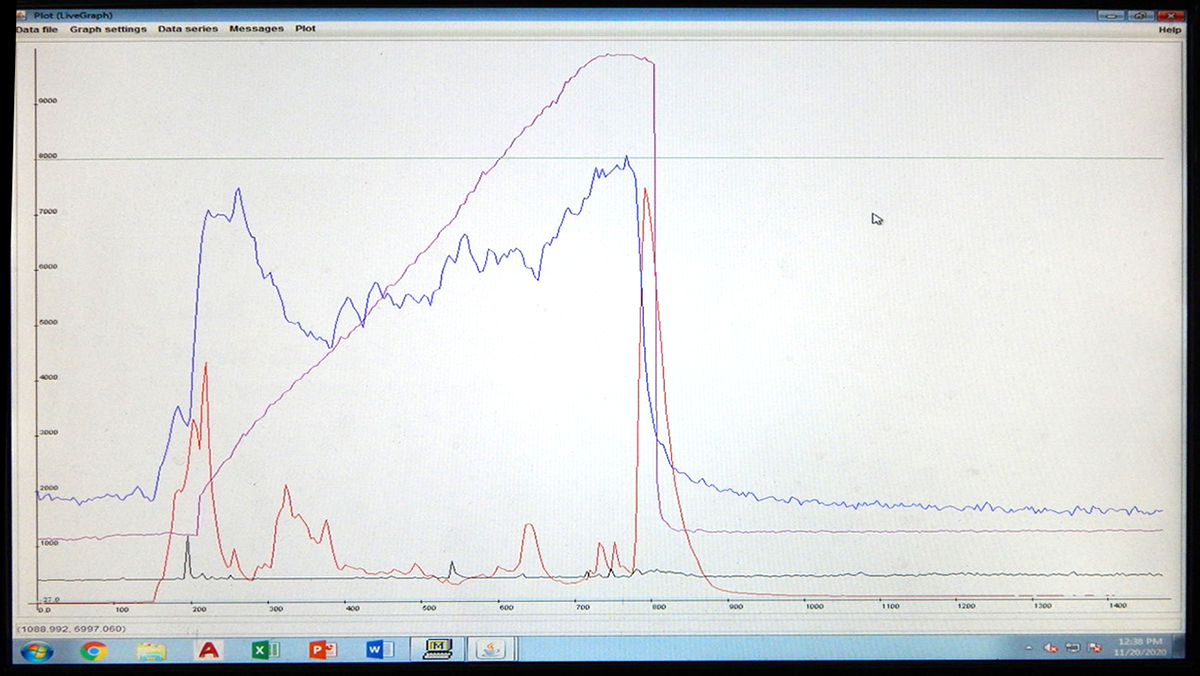
Starting in early December, Dean Still and a research assistant will be doing 20 tests per week to create an optimized forced draft insert that cleans up the combustion of found biomass fuels and improves thermal efficiency in open fires, high mass, and Rocket stoves. A screen in the hood showing real-time data helps reduce the needed repetitions to achieve statistical confidence. The 90% confidence interval has to be less than 1/3 of the range of the Tier that contains the conservative bound of the confidence interval. When Tier Confidence Interval Range is equal to or less than 0.33, the number of tests is deemed sufficient to meet the Aprovecho data repeatability quality standard (seven to nine tests each for high, medium, and low power are usually sufficient).
David is in grad school with Dr. Nordica MacCarty at Oregon State University and the ARC lab is supplying them with information. We’ll keep you in the loop as we make discoveries. Part of the goal is to keep the optimized insert as close to a $10 wholesale price as possible.
Here we go! Eco-Science marching forward!


Leave a Reply
Want to join the discussion?Feel free to contribute!